
Fixed criteria
The same rules applied to every stock, every day. No gut feeling halfway through.

A system that reads around 650 stocks every day, places each one in its stage of the cycle, and writes the reasoning behind every call. The weekly timeframe tells you if a stock is trending; the daily tells you when to act.
The method
That is Stan Weinstein's reading, and it is the backbone of the whole system. The 30-week moving average separates the stages — and what matters is not price being above it, but the average itself turning up. Only Stage 2 is a buying zone.
The same rules applied to every stock, every day. No gut feeling halfway through.
Every call comes explained: what lines up, and what is still missing to trigger it.
Each stock measured against its sector — whether it leads, or is just riding the tide.
Weekly trend and daily signal read together. Either one alone will mislead you.
How it works
The order matters. Filtering by the underlying trend first is what stops you chasing bounces inside falling markets — the mistake that costs the most.
First
Every stock is rebuilt into weekly candles and placed in one of the four stages, from its position against the 30-week average and the slope of that average.
weekly · says IFThen
For those already trending, the daily reading runs: moving averages, RSI, MACD, ADX, Bollinger bands, volume and divergences.
daily · says WHENFinally
A language model receives the indicators already calculated and writes the reasoning for each candidate, plus the overall market read.
context · says WHYThe analysis
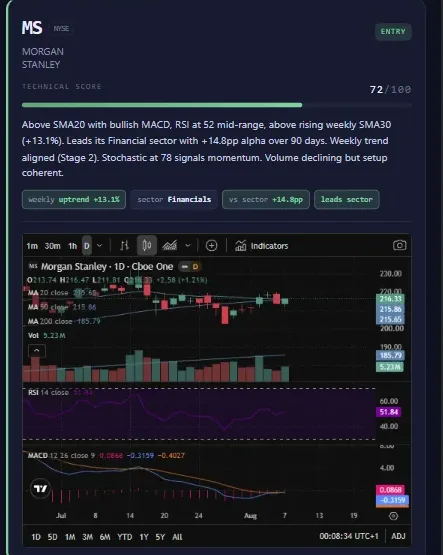
One card per stock, with the price, the indicators, the weekly stage, how it compares to its sector and — when it is close — exactly what has to happen for the signal to trigger.
Above the 20- and 200-day averages, RSI neutral at 53, lined up with a weekly trend pulling back to a rising average. Leads the defensive consumer sector.
Pricing
No tiers, no add-ons, nothing held back for a higher price. You either have access to the system or you don't.
Full access
29 USD first year + tax
Renews automatically at USD 79 per year, once a year, until you cancel. Cancel any time.
USD 29 for your first year, then USD 79 per year. The subscription renews once a year at USD 79 and keeps renewing until you cancel; you can cancel at any time, and access runs to the end of the year you already paid for. Both figures are net of tax — VAT or sales tax is added where applicable, so the amount actually charged is higher. The exact total for your country, including tax, is shown at checkout before you pay. Billed annually in advance.
Secure checkout by Paddle · cancel any time
Refund and cancellation policy
The work of reading hundreds of stocks every day against a fixed set of criteria — and doing it the same way on the days when it is tedious as on the days when it is interesting. That is the part a person cannot sustain and a system can.
Advice. Nobody here tells you what to buy, and nothing is tailored to your situation. The system reads the market and shows its reasoning; the decision stays yours. See the risk disclosure.
Use the manage-subscription link in any Paddle receipt, or email us and we action it. Access runs to the end of the period you already paid for, and the subscription simply stops renewing. Full terms in the refund and cancellation policy and the terms of service.
JPSPINTO Stocks GenAI produces automated technical readings for informational and educational purposes only. Nothing shown here constitutes financial advice, a recommendation to buy or sell, or an offer or solicitation regarding any financial instrument.
By using this site you accept these terms and acknowledge that the operator accepts no liability for any losses arising from the use of the information provided here.